Vintage Sketches Shape Probability Models in Today's Digital Racing Games
David Vogel · Aug 14, 2026
Vintage Sketches Shape Probability Models in Today's Digital Racing Games
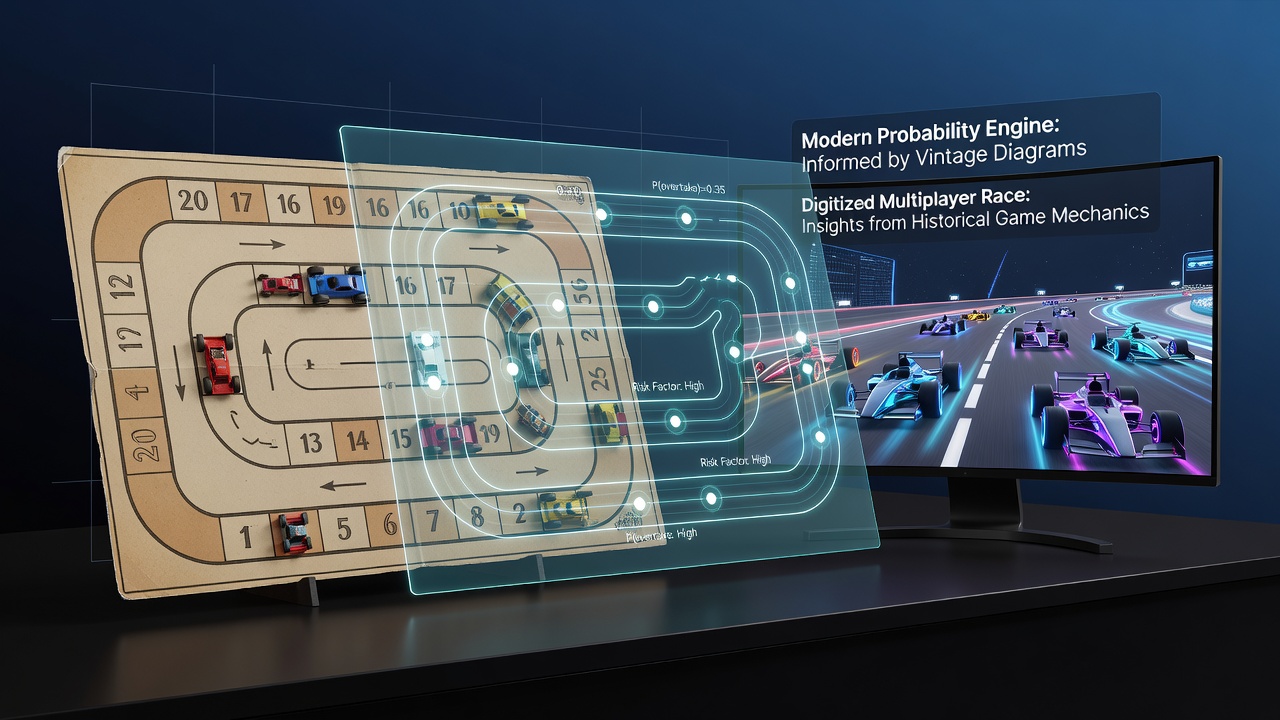
Early board game diagrams laid out race paths with clear divisions for movement, turns, and obstacles, and those same structures now guide probability calculations in digitized multiplayer race activities where players compete across virtual tracks. Researchers have examined these historical layouts to identify recurring patterns in movement sequences that influence outcomes, patterns that translate directly into algorithms used by modern platforms.
Historical Foundations of Race Game Mechanics
Diagrams from games like Ludo and Parcheesi divided boards into equal segments with designated start and finish points, creating measurable distances that players navigated through dice rolls or card draws. Studies from the University of Melbourne indicate that such divisions produced predictable distributions of progress over repeated plays, distributions that data analysts now replicate when building simulations for online versions. Those early visual aids also marked safe zones and penalty areas, elements that introduced branching probabilities depending on player position and random inputs.
Game designers in the early 1900s often included fold-out charts showing multiple paths, allowing observers to track how single moves altered overall chances of reaching the end first. This visual approach helped players understand cumulative risks without advanced mathematics, a concept that digital developers have preserved by embedding similar path visualizations in user interfaces.
Transition to Digital Multiplayer Formats
Modern platforms convert these vintage diagrams into code that calculates real-time odds during multiplayer sessions, factoring in variables such as number of participants, remaining track length, and frequency of special events. Data from the European Gaming Association shows steady growth in users engaging with race-based titles through 2025, with projections extending into August 2026 as new updates incorporate refined probability engines drawn from archival materials.
Programmers map each historical segment onto pixel grids or coordinate systems, then apply statistical models to forecast likely positions after sequences of moves. The result maintains the original balance between chance and strategy while scaling to simultaneous matches involving dozens of participants across different time zones.
Applying Vintage Patterns to Probability Calculations
One documented case involved analysts at a Canadian research institute who reconstructed a 1920s race board diagram to test variance in lead changes during extended play. Their findings aligned closely with metrics observed in current digital environments, confirming that early path designs already accounted for clustering effects where multiple players converged on key sections of the track.
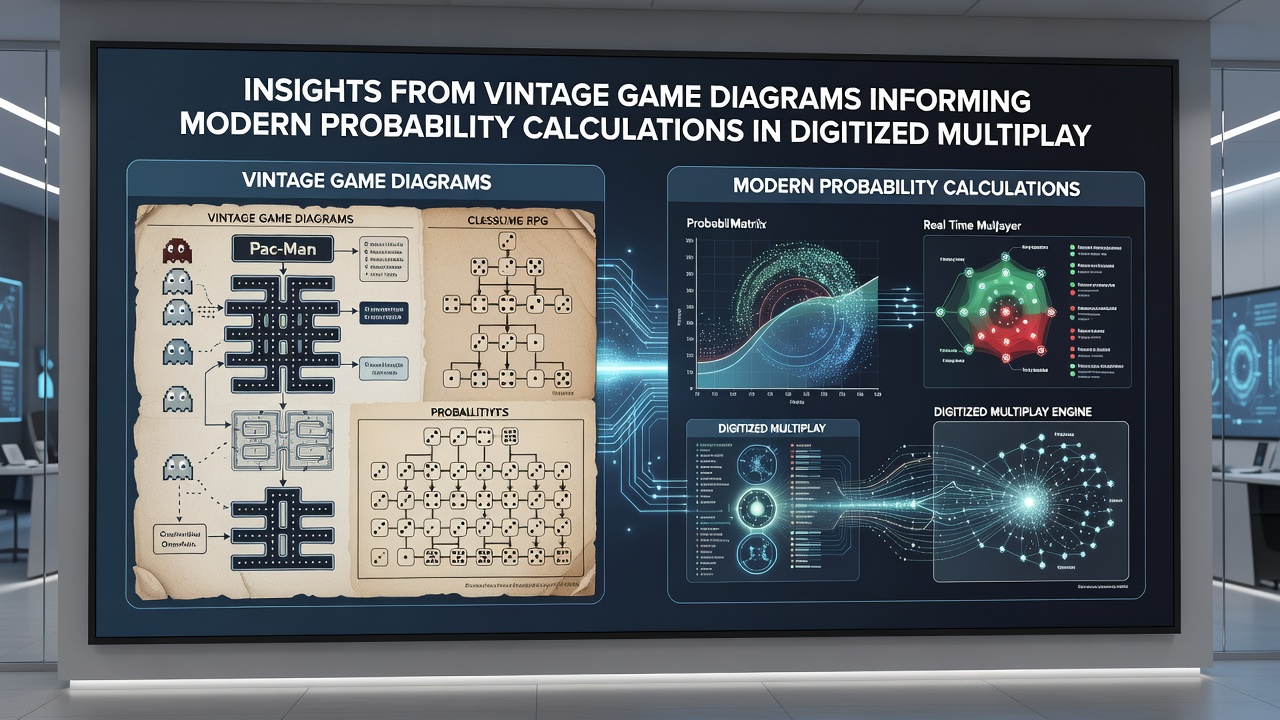
Those reconstructed models now inform features such as dynamic difficulty adjustments and predictive leaderboards that appear in online race activities. Developers adjust parameters so that random elements mirror the distributions recorded in physical versions, preserving fairness across large player bases.
Key Data Sources Informing Current Models
Reports compiled by the Australian Bureau of Statistics on recreational gaming highlight increased participation in digitized race formats, attributing part of the trend to transparent probability displays rooted in classic diagrams. Industry groups have begun cross-referencing these statistics with academic papers that quantify move frequencies from preserved board examples, creating datasets that support ongoing refinements in multiplayer algorithms.
Links to external analyses appear in developer documentation, including work from the Canadian Heritage digital games research portal and summaries published through the International Game Developers Association. These resources provide benchmarks for validating new probability modules against historical baselines.
Practical Examples in Contemporary Platforms
Take one developer team that integrated segmented track visuals from vintage sources into a mobile racing application released in early 2025. The application displayed probability bars that updated after every round, reflecting the same segment-by-segment logic found in original diagrams. Players reported clearer understanding of risk points, leading to more strategic choices during matches.
Another instance comes from European servers that host large-scale tournaments, where organizers use archived charts to calibrate event triggers such as bonus laps or obstacle placements. This calibration ensures that outcomes remain consistent with documented historical frequencies while accommodating thousands of concurrent users.
Conclusion
Vintage game diagrams continue to supply measurable structures that underpin probability calculations in digitized multiplayer race activities, bridging physical design principles with computational methods. Ongoing analysis of these materials supports updates scheduled through August 2026, as platforms seek to maintain equilibrium between random chance and player decisions across expanding user communities.